


What Is the Average ATAR and How Does It Work?
ATAR score | Study Plan | How is ATAR Calculated
Discover what is the average ATAR for Australian students, what an ATAR score means for your child and how to help them get ahead of their Year 12 exams.
Picture this: You’re waiting to pick up your child after school with a couple of other parents when the conversation suddenly turns serious. Another parent mentions their eldest just received their predicted results. Suddenly, numbers are flying around: 65, 80, 99.95. You smile and nod, but internally, a knot of anxiety is tightening. What do these numbers actually mean? Why is ATAR important? Is a 70 ATAR good? Is a 60 a disaster? What is a good ATAR score?
There is perhaps no acronym in Australian education that causes more sleepless nights than the Australian Tertiary Admission Rank (ATAR). Whether your child is anxiously preparing for their final VCE exam block in Victoria or gearing up for the intense marathon of HSC exams in New South Wales, the pressure to “beat the average” is immense.
But here is the trap: most parents assume the “average” ATAR is 50.00. It makes logical sense, right? It’s a rank from 0 to 99.95, so 50, therefore, must be the dead centre.
Unfortunately, it’s a bit more complex than that. In this blog we explain what the true average ATAR is, what a specific ATAR might mean for your child, and if ATAR tutoring is right for your child. Check out more blogs about the ATAR and HSC on our JDN Tuition Blog Page.
What is the Actual Average ATAR?
If the ATAR is a rank from 0 to 99.95, simple maths suggests the average should be 50.00. But if you’re expecting a 50 to be the standard “middle ground,” you are setting your benchmarks too low. In reality, the average ATAR for high school students who sit the exams is significantly higher.
To uncover the truth, we need to look at the median, or the score of the student sitting exactly in the middle of the pack. For the 2024/2025 cohort, the national median sits much closer to 70.00 rather than 50.00.
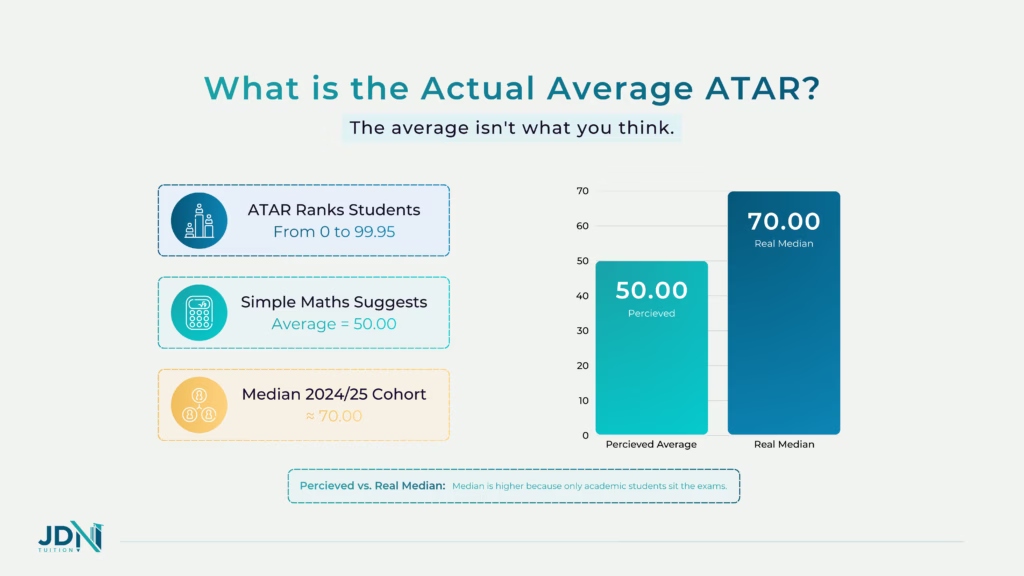
So why the discrepancy? The ATAR ranks students against their entire age group, including thousands who left school early or chose vocational pathways. Because the students sitting year 12 exams are already a smaller, more academic group, the median score pushes upward.
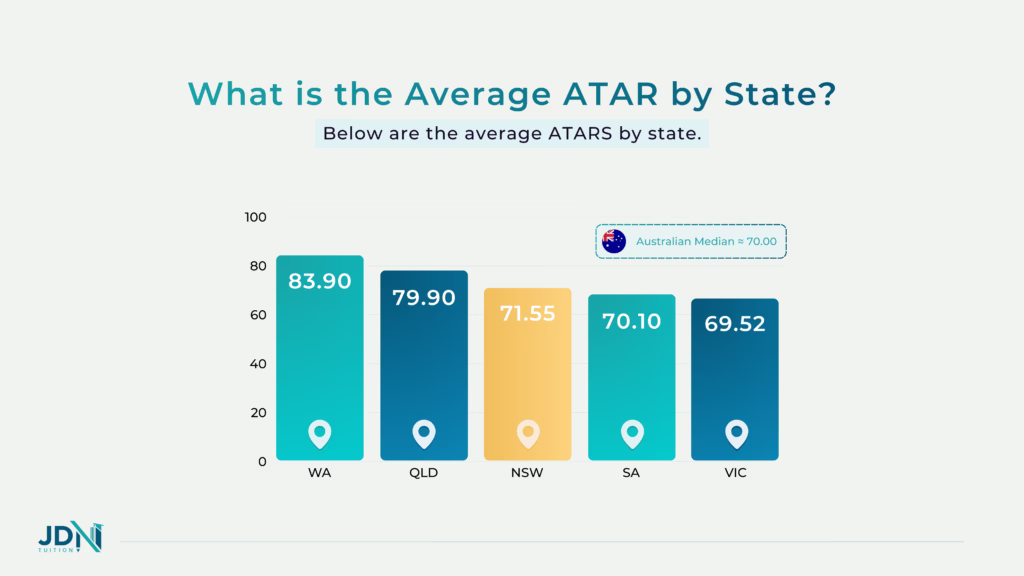
What is the Average ATAR by State?
While the systems vary slightly, the data from the most recent results paints a consistent picture across the country. Below are the average ATARs by state.
NSW (HSC) Average ATAR
The median ATAR for NSW students in 2024 was 71.55. Interestingly, female students slightly outperformed males with a median of 72.40 compared to 70.40. Your child’s HSC marks are heavily influenced by how their raw results compare to the state average in their chosen HSC courses.
Victoria (VCE) Average ATAR
The median ATAR was slightly lower but comparable at 69.52. Performance in VCE subjects like English and Methods continues to be a strong predictor of rank, but scaling plays a massive role here.
Queensland (QCE) Average ATAR
Queensland has shown a strong performance, with a median often sitting higher, approximately 80. This consistently high result reflects the state’s rigorous curriculum and competitive school environment.
Western Australia (WACE) Average ATAR
WA often reports a much higher median of around 83.90. This is not because the exams are easier, but because fewer students sit the ATAR exams (participation rate is lower), making the pool of students more competitive.
South Australia (SACE)
The average ATAR generally aligns with the national standard of around 70.00. However, top-tier private schools in Adelaide often report medians well above 85.00.
What Drives the ATAR?
Achieving a “good” ATAR score isn’t just about hard work; it’s about strategy. The highest ATAR score is, of course, the elusive 99.95, achieved by only the top 0.05% of students. However, for the majority, the battle is won or lost in subject selection.
Many parents don’t realise that compulsory subjects, like English HSC courses in NSW, are required to count towards the ATAR, meaning a poor performance there drags down the entire rank. Conversely, smart HSC subject selection, such as picking courses that align with a student’s strengths rather than just “high scaling” ones, is often the difference between an average of 70 and a standout score of 85+. The key is to remember that an “average” HSC subjects portfolio typically yields a 70.00, which is actually a solid foundation for university degrees and entry.
The “Bell Curve” Explained
To truly understand your child’s position, you need to stop visualising a ladder and start picturing a bell. The distribution of student performance is not a flat line; it is a curve that bulges heavily in the middle and tapers off at the extreme high and low ends. In this crowded middle ground, the difference between a 70.00 and a 75.00 might come down to just a few marks in a single exam.
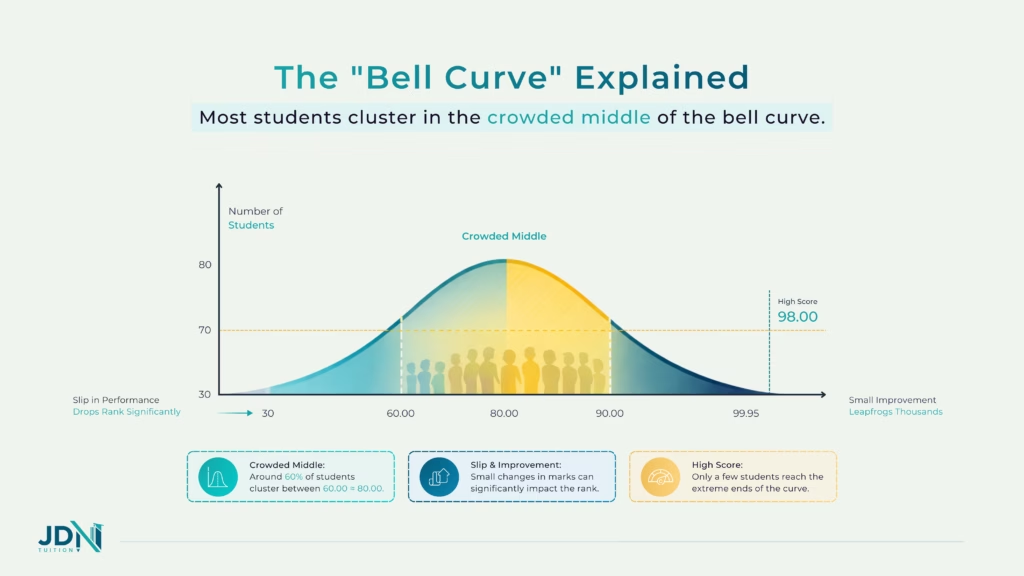
This concentration of students highlights why the ATAR calculation is so unforgiving. Because the “middle” is so packed, a small slip in performance can drop a student’s rank significantly, while a small improvement can see them leapfrog thousands of peers. This is particularly true in competitive VCE subjects like Chemistry or Math Methods, where the competition is fierce, and the “average” student is already quite academically capable.
The Effect of the School Bubble
The perception of “average” becomes further skewed by their “school bubble.” If your child attends a high-performing private or selective school, people might whisper about a score of 80.00 as a disappointment. However, once you have the ATAR explained in the national context, you realise that an 80.00 places that student in the top 20% of the state, which is a fantastic achievement. The danger lies in complacency. Because the curve is so steep in the middle, students often need external support to distinguish themselves from the pack. This is where strategic help from private tutors becomes invaluable, helping students find those extra few marks that push them out of the congested middle and into the top tier.
Helping Your Child Break Away from the Average
Is your child stuck in the crowded middle of the Bell Curve? At JDN Tuition, we specialise in finding the “hidden marks” that others miss. Whether it’s refining exam technique or mastering difficult syllabus points, our year 12 tutoring experts can help your child break away from the average. Check out our Google Business Profile and take a look at how we can help your child with our high school tutoring.
The “Hidden” Statistics: Who isn’t Counted?
To fully grasp how does the ATAR work, we have to look at the “ghosts” in the machine, the thousands of students who are technically part of the ranking calculation but never actually sit an exam. The ATAR ranks a student relative to their entire age cohort, not just those in the exam hall. It includes students who left school in Year 10 for apprenticeships, chose non-ATAR vocational pathways, or entered the workforce early.
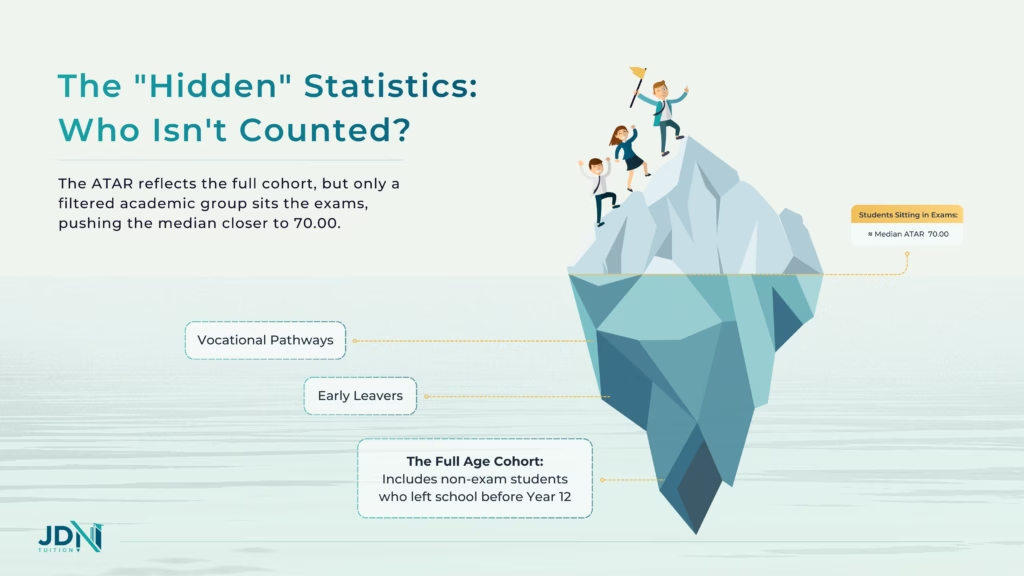
This means that if every single 17-year-old in Australia sat the exams, the average ATAR would indeed be 50.00. However, the students who remain to tackle Year 12 and demanding selective subjects are already a self-filtered, academic group. Consequently, the “average” of this competitive group shifts up to around 70.00.
Is My Child’s ATAR Good?
A score of 70.00 might seem decent, but how does it compare? And does an 85.00 go far enough? These are common questions, but they often miss the mark. To understand if a score is “good,” we first need to clarify what is ATAR used for. It is simply a rank used by universities to allocate places in competitive courses and nothing more, nothing less. A “good” ATAR is simply one that gets your child into their dream course. For a Bachelor of Arts, Nursing, or Business, an ATAR of 70.00 is often excellent and guarantees entry. Conversely, for Medicine or Law, a 95.00 might still fall short.
Parents often ask, “does your ATAR really matter after university begins?” The answer is a resounding no. Once that door is open, the number is forgotten; no employer asks for an ATAR on a CV. The stress arises only when there is a mismatch between a student’s goal and their current trajectory. If your child is aiming for a competitive Engineering degree but is tracking towards the average, they don’t need to panic, they need a strategy.
This is where specific, goal-oriented support becomes crucial. Professional HSC tutoring can help bridge the gap between a student’s current performance and their required entry rank. Whether you need in-person support or the flexibility of online tutoring Australia wide, the right mentorship focuses on the specific subjects that will yield the highest rank increase to meet those university cut-offs.
How to Help Your Child Beat the Average
Beating the “average” isn’t about forcing your child to pull all-nighters; it is about helping them work smarter, not harder. Many students plateau around the 70.00 mark because they rely on rote learning rather than strategic application. This requires a shift in focus towards targeted skill development, ensuring that every hour of study directly translates to points on the exam paper.
The foundation of this strategy is rigorous organisation. Students must master time management skills early in the year to avoid the dreaded Term 3 burnout. A rigid, well-structured study timetable is the best defence against procrastination, allowing students to balance content revision with active practice. Crucially, “active practice” means simulating exam conditions. There is no better resource than past HSC papers or past VCE exams. These documents are the blueprint for success, revealing exactly how markers award top bands and where the “average” student typically loses marks. By consistently testing themselves against these real-world standards, students inoculate themselves against exam-day stress.
However, self-study has its limits. Is your child’s projected ATAR slipping below their course requirements? Don’t leave their university entry to chance. Contact JDN Tuition today to learn how to maximise your potential ATAR. Take a look at our reviews to see how we can help your child succeed.
What is the Average ATAR? Key Takeaways for Parents and Students
Understanding what is the average ATAR is surprisingly harder than it seems. It being 70.00 changes the conversation entirely. It means that if your child is tracking towards this number, they are already performing at a solid standard for their age group. If their university goals demand a higher rank, or if they struggle to find their footing in the crowded middle of the bell curve, the right strategy can make all the difference.
Expert guidance and targeted preparation often bridge the gap between an average result and a dream offer. JDN Tuition can help. Our experienced tutors work closely with students to identify strengths, target weaknesses, and build the confidence needed to excel under pressure. If you are ready to unlock your child’s full academic potential and turn their hard work into a competitive advantage, contact us at JDN Tuition today. Together, we can create a personalised plan that maximises results and helps your child stand out in a crowded field.
Improve Results. Start Today.
📞 Book a FREE Call: (02) 7257 0299
📧 Email us: [email protected]
What is the average ATAR for Australia?
The national median ATAR for students who sit the exams typically hovers around 70.00. For example, the 2025 NSW median was 70.75. This number is higher than 50.00 because the ranking includes the entire age population, including early school leavers. In other words, the students actually sitting the exams are already more academic than the general population.
Is getting a 70 ATAR hard?
A 70.00 ATAR places a student in the top 50% of all students who sat the Year 12 exams. While a student who works consistently and completes all their coursework may not find it hard, achieving it still requires a solid commitment to study - you cannot simply coast to a 70.
How many people get a 99.95 ATAR?
This perfect rank is incredibly rare, awarded only to the top 0.05% of the cohort. In practice, the number is very small; for instance, in 2025, only 53 students in NSW and roughly 40-50 students in Victoria achieved a 99.95.